Conor Wilcock of B2B International calls himself “unashamed to be a complete data nerd.” How much of a data nerd is he? When his newborn son was keeping him up at night he made a database of the baby’s sleep patterns for the first eight weeks, including variables such as room temperature, amount of milk drunk, length of naps. Then he ran a data regression to discover optimal sleep length was dependent on (drum roll, please) baby drinking a lot of milk. At his session on building lasting experiences using customer data at Cvent Connect (held in Las Vegas, June 12-16) Wilcock said that despite his jet lag after flying out from London, he had had the best night’s sleep in a long time.
Wilcock started his session by saying, “What I love about data is you can use it to predict the future. And, armed with those insights, you can influence what will happen in the future.” He urged session attendees to consider what types of customer data they were collecting, what types should they be collecting, and what they need to do with the data to better serve their event attendees, associations, or company brand.
The Three Vs of Customer Data
Wilcock defined the three Vs of customer data: volume, variety, and velocity. In terms of volume and variety, the more the merrier. Collect information at every touchpoint with your customers. Not just the annual survey but every piece of transactional data, primary sources such as surveys, and secondary data such as public domain information about local and national economies, weather, anything that might affect your clients’ decisions before an event or their feelings during an event. Collect automated data, for example at registration, but talking to sales people and even temporary staff at events also can give you useful insights into how your attendees feel and enough anecdotal information about customer responses to your event can show patterns you can use.
Wilcock quoted Yogi Berra’s insight into data collection, “You can observe a lot just by watching.”
The third V, velocity, describes how the data is collected. Data collected in real time, such as session surveys on your event app, can influence your choice of topics and speakers for your next conference. “Slow” data, for example an annual survey or reaching out to sales people, can reveal whether your clients absorbed your education sessions or were still influenced by your messaging several months later.
Journey Mapping
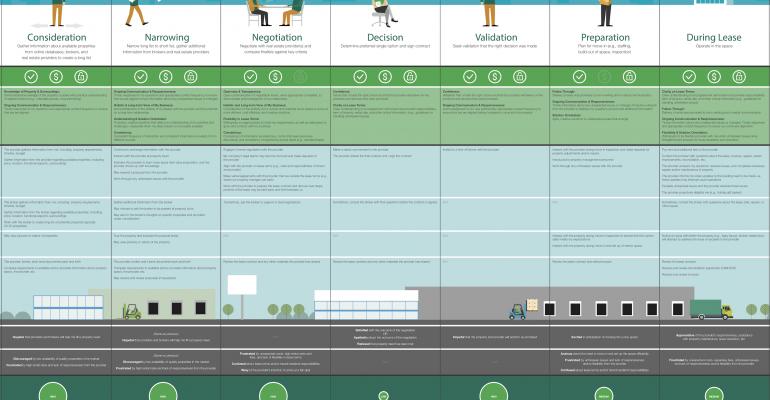
Now you have your customer data, what do you do with it? You can use your insights to improve your events, but if your company loses all its customers you lose your attendees, so it’s time to provide a mechanism to share your insights with everyone who can benefit from them. A visual roadmap of the customer journey is a great way to do this.
Begin by documenting why a customer chose you. How did they hear about you? What attracted them to you? If your product has particular features that customers value, every department needs to know so that they can provide better customer service, R&D, and education based on that. Journey mapping helps disseminate this information throughout the organization. In terms of your events, repeating education sessions means clients don’t have to choose one over another—don’t make them go home and explain to their boss why they missed training on one aspect of your product.
A journey map should start with the customer’s awareness of your brand, what considerations they take into account when choosing a product, what factors were important to them in negotiating a contract with your company, what customer service or help desk issues they ran into, and what rewards and pain points influenced their decision to upgrade or end their relationship with you.
Wilcock stresses it is important to own the role of managing data and insights. Creating a journey map for your clients requires you to collect and disseminate the information to each department, so don’t allow customer data to sit in silos.
The journey map should include a visual representation of each stage in the customer journey, and beneath it the following factors:
• The customer’s motivation: What problem are they addressing by using your company? • Emotions: What are they worried about? How can you address those concerns?
• Interactions: Who are they talking to? Who should they be talking to?
• Needs: What are their must-haves? What can you surprise them with that they didn’t know they needed?
• Performance: Are you taking care of them? What departments need to be involved to provide the best customer care possible?
Every department in your company should be able to see how they influence each stage of the customer’s journey.
Comprehensive customer data can help your company provide a smoother ride for clients, but it can also show the ways in which each department contributes to the company bottom line. For meeting planners, your impact should be visible at multiple stages of the journey map showing ROMO (return on marketing objectives) from providing initial customer brand awareness to product education and customer retention.
Customer data can also highlight things that are out of your control. Wilcock shared a case study that his company had undertaken for a large corporate travel agent where he correlated customer satisfaction data with the weather. His conclusion? Clients will be dissatisfied with everything if the weather is bad. Actionable takeaway for meeting planners: Choose your location wisely.


