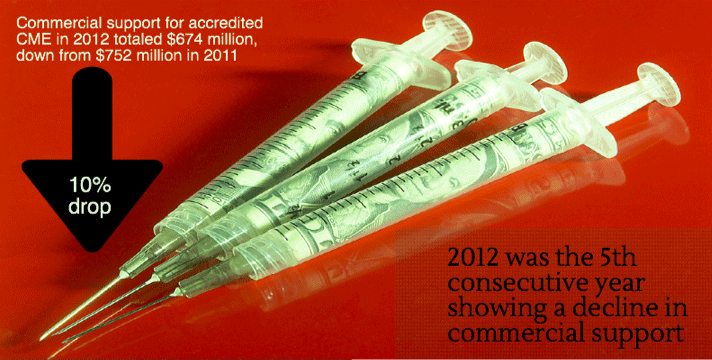
According to the Accreditation Council for Continuing Medical Education’s 2012 Annual Report, total income for ACCME- and state-accredited CME providers topped $2.4 billion in 2012, a 5 percent increase over 2011, even though commercial support slid more than 10 percent year-over-year to $752 million. This is mainly due to an almost 14 percent increase in “other income,” which in the report means things like registration fees, and allocations for a provider’s parent organization or other internal departments.This source of income, which topped $1.4 billion in 2012, accounted for 59 percent of accredited providers’ total income. Commercial support, which made up half of total income six years ago, in 2012 comprised just 27 percent. Advertising and exhibits, the third main income producer at 14 percent, also was up 17 percent to more than $331 million in 2012. Eighty-two percent of the ACCME-accredited providers received no commercial support, and 81 percent of physicians and 78 percent of non-physicians participated in non-commercially supported activities from these providers.
Total expenses also were up, though not quite keeping pace with total income, rising 4.2 percent to $1.3 billion
 As has historically been the case, publishing/education companies lead when it comes to receiving commercial support (not including in-kind support, which ACCME took out of the equation last year). Publishers and medical education companies reported that more than $271 million—about 44 percent of their total income—came from commercial support in 2012, down slightly from 46 percent of total income in 2011. Most of the rest of publishing/education company income derived from that “other” category of registration fees and other allocations. Medical schools also received a healthy 41 percent (more than $160 million) of their income in the form of commercial support; more than half of the rest was “other” income.
While the next largest receiver of commercial support, the nonprofit physician membership organization sector, took in more than $124 million of this type of income, that represented a less than 13 percent slice of this type of provider’s total income pie; almost 63 percent was in the “other” category. Advertising and exhibit income made up almost a quarter of the remainder for these organizations’ total income, making this revenue source by far more important for them than for the other provider types. Note: In 2010, ACCME’s system stopped asking providers to include the monetary value of in-kind support, asking them to report it qualitatively (equipment, supplies, facilities, etc.) instead of assigning a dollar value to it.
ACCME-accredited providers received almost 94 percent of the combined total income in 2012, even though they comprised just 34 percent of the total number of providers reporting. State-accredited providers also accounted for less than 2 percent of the commercial support income in 2012, so these combined totals generally reflect trends in ACCME-accredited providers. ACCME-accredited providers for the most part serve national and international audiences, while state-accredited providers generally work on a state or regional basis. Both sets of accreditors require their providers to follow strict standards. ACCME-accredited providers have been required to report their information in the ACCME’s Program and Activity Reporting System, or PARS, since its 2010 launch, though the accreditor has been collecting the data in other ways since 1997. In 2012, 21 of the 43 state/territory medical societies ACCME recognizes as accreditors—who represent 576 of the 1,319 state-accredited providers—chose to use PARS as well and are included in the combined data.
Size of the Enterprise
There were 2,000 ACCME- and state-accredited providers in 2012, down 3.8 percent from 2,079 in 2011. Of these, 681 were ACCME-accredited, a number that has been dropping since 2007 when they numbered 736. The number of state-accredited providers also has been declining, with there being 365 fewer reporting now than there were six years ago. Altogether, this represents a 17 percent drop in accredited providers since 2006.
ACCME-accredited providers held 69 percent of the more than 133,000  directly and jointly sponsored activities reported for ACCME- and state-accredited providers in 2012, while 31 percent were from state-accredited organizations. The number of activities held is up a smidgen of a percent from the 2011 total. Hospitals and healthcare systems accredited by both types of organizations provided about 35 percent of the total activities. Medical schools were next with 20 percent, followed by nonprofit physician membership organizations (18 percent); publishing/education companies (16.5 percent); other nonprofits (3 percent); government/military (3 percent); insurance/managed care companies (2 percent); and “other” (1.8 percent). The “other” category consists of ACCME- and state-accredited organizations that in previous years fell under the “not classified” category. ACCME reclassified 38 of its “not classified” providers into appropriate categories according to their business model; state-accredited providers just were shifted from “not classified” to “other.”
Data from just ACCME-accredited providers told a slightly different tale, with medical schools producing almost 28 percent of the activities, followed by publishing/education companies at almost 23 percent. Next were nonprofit physician membership organizations, which at 17 percent just barely edged out hospitals/healthcare systems as the next largest activity producers.
The total CME enterprise provided 988,208 hours of instruction, up 3.72 percent from 2011. The total hours have been sliding since 2009, when the number dropped to under 1 million. Hospitals/healthcare systems also led the field in hours of instruction provided, followed by medical schools, when state- and ACCME-accredited providers information was combined. Some of the fluctuation in the hours of instruction reported over the years is due to changes in how some activities must be reported, according to the ACCME. Taking just ACCME-accredited provider data, medical schools take the lead, providing almost half of the hours of instruction, followed by nonprofit physician membership organizations at 17 percent.
Docs and Other HCPs
There were a total of more than 14 million physician participants at ACCME- and state-accredited provider activities in 2012, up almost 5 percent from 2011. This represents a steady growth in physician participants over the past several years. While hospitals/healthcare systems and medical schools may have held the most hours and activities for the total accredited CME enterprise, publishing/medical education companies drew the most physician participation, attracting more than three times as many physicians to their directly sponsored Internet enduring materials as the next leading contender, nonprofit physician membership organizations, and 35 percent more than physician associations to their jointly sponsored Web enduring materials.
 When you break out those accredited by the different bodies, 84 percent of these physicians participated in activities from ACCME-accredited providers, with publishing/education companies being the biggest draw from this provider group, followed by medical schools and nonprofit physician membership organizations. For state-accredited providers, hospitals/healthcare delivery systems far outdistanced the other provider types in the number of physicians participating in their activities.
There were more than 10 million non-physicians participating in ACCME- and state-accredited CME in 2012, up almost 7 percent from 2011 and almost 92 percent since 2005. Eighty-three percent of these HCPs attended activities by ACCME-accredited providers; the remaining 17 percent participated in activities from state-accredited providers. Growth rates for both provider groups reflected the rate for the CME enterprise as a whole.
Formats
At 69,140, courses were the most-offered format for the enterprise as a whole, including directly and jointly sponsored. ACCME-accredited providers produced the majority of the total courses reported, almost 64 percent. Internet enduring materials were next, at 26,711 (almost 93 percent of these were offered by ACCME-accredited providers). Regularly scheduled series such as grand rounds were third with 22,460 in the combined data, though these were second with state-accredited providers, who were responsible for almost 54 percent of the total RSS activities in 2012. Combined, the top three formats comprised 88 percent of the CME offered in 2012. Filling in that last 12 percent were live Internet activities, test-item writing, committee learning, performance-improvement CME, Internet searching and learning, non-Internet-based enduring materials, learning from teaching, journal CME, and manuscript review.
 However, enduring Internet materials takes over the top spot when it comes to numbers of participants for the combined providers: This was the most highly consumed format by both docs (almost 5 million) and other HCPs (more than 5 million). The next most-attended format was RSS, which drew more than 4 million docs and more than 2 million other HCPs. Courses rounded out the top three, attendance-wise, with more than 2 million physician and 1.5 million non-physician HCPs.
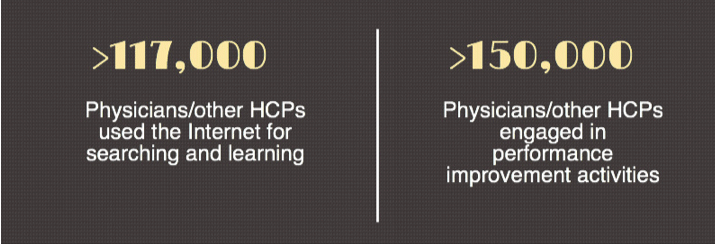
While small in numbers, performance improvement activities were up to 631 activities in 2012 (jointly and directly sponsored) from the 2011 total of 502 PI CME activities, with about 54 percent being conducted by state-accredited providers. But the real story is in the number of attendees: In 2012, PI CME drew 141,860 physicians and 9,124 non-docs (150,984 in total). In 2011 there were 44,275 docs and 7,492 nondocs (51,767 total) participating in PI CME, so a 25 percent increase in the number of activities drew a more-than 190 percent increase in participants.
The Internet searching and learning format also poses some interesting numbers when looking at the combined data. In 2012 there were just 90 total activities reported using this format, 84 percent fewer than the 587 Internet search and learning activities reported in 2011. And yet there was a 21 percent growth in participants—18 percent more docs, and 78 percent more non-physician HCPs—over 2011.
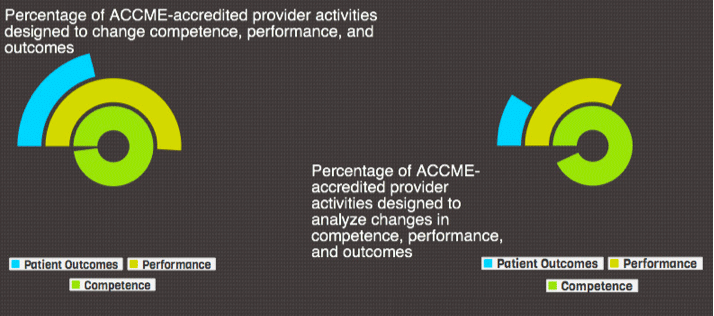
ACCME also asked its providers to report whether their activities were designed to change competence, performance, or patient outcomes, and if they analyzed the results for change in competence, performance, or patient outcomes. While almost all reported their activities were designed to change competence, just slightly more than half of their activities were designed to change performance, and only about a fifth were designed to change patient outcomes. When it came to analyzing the results of their outcomes studies, just over 90 percent of activities were analyzed for changes in competence, about a third were studied for changes in performance, and less than 10 percent were evaluated for changes in patient outcomes.


